
Monthly Chemical Price Dashboard Methodology
Introduction
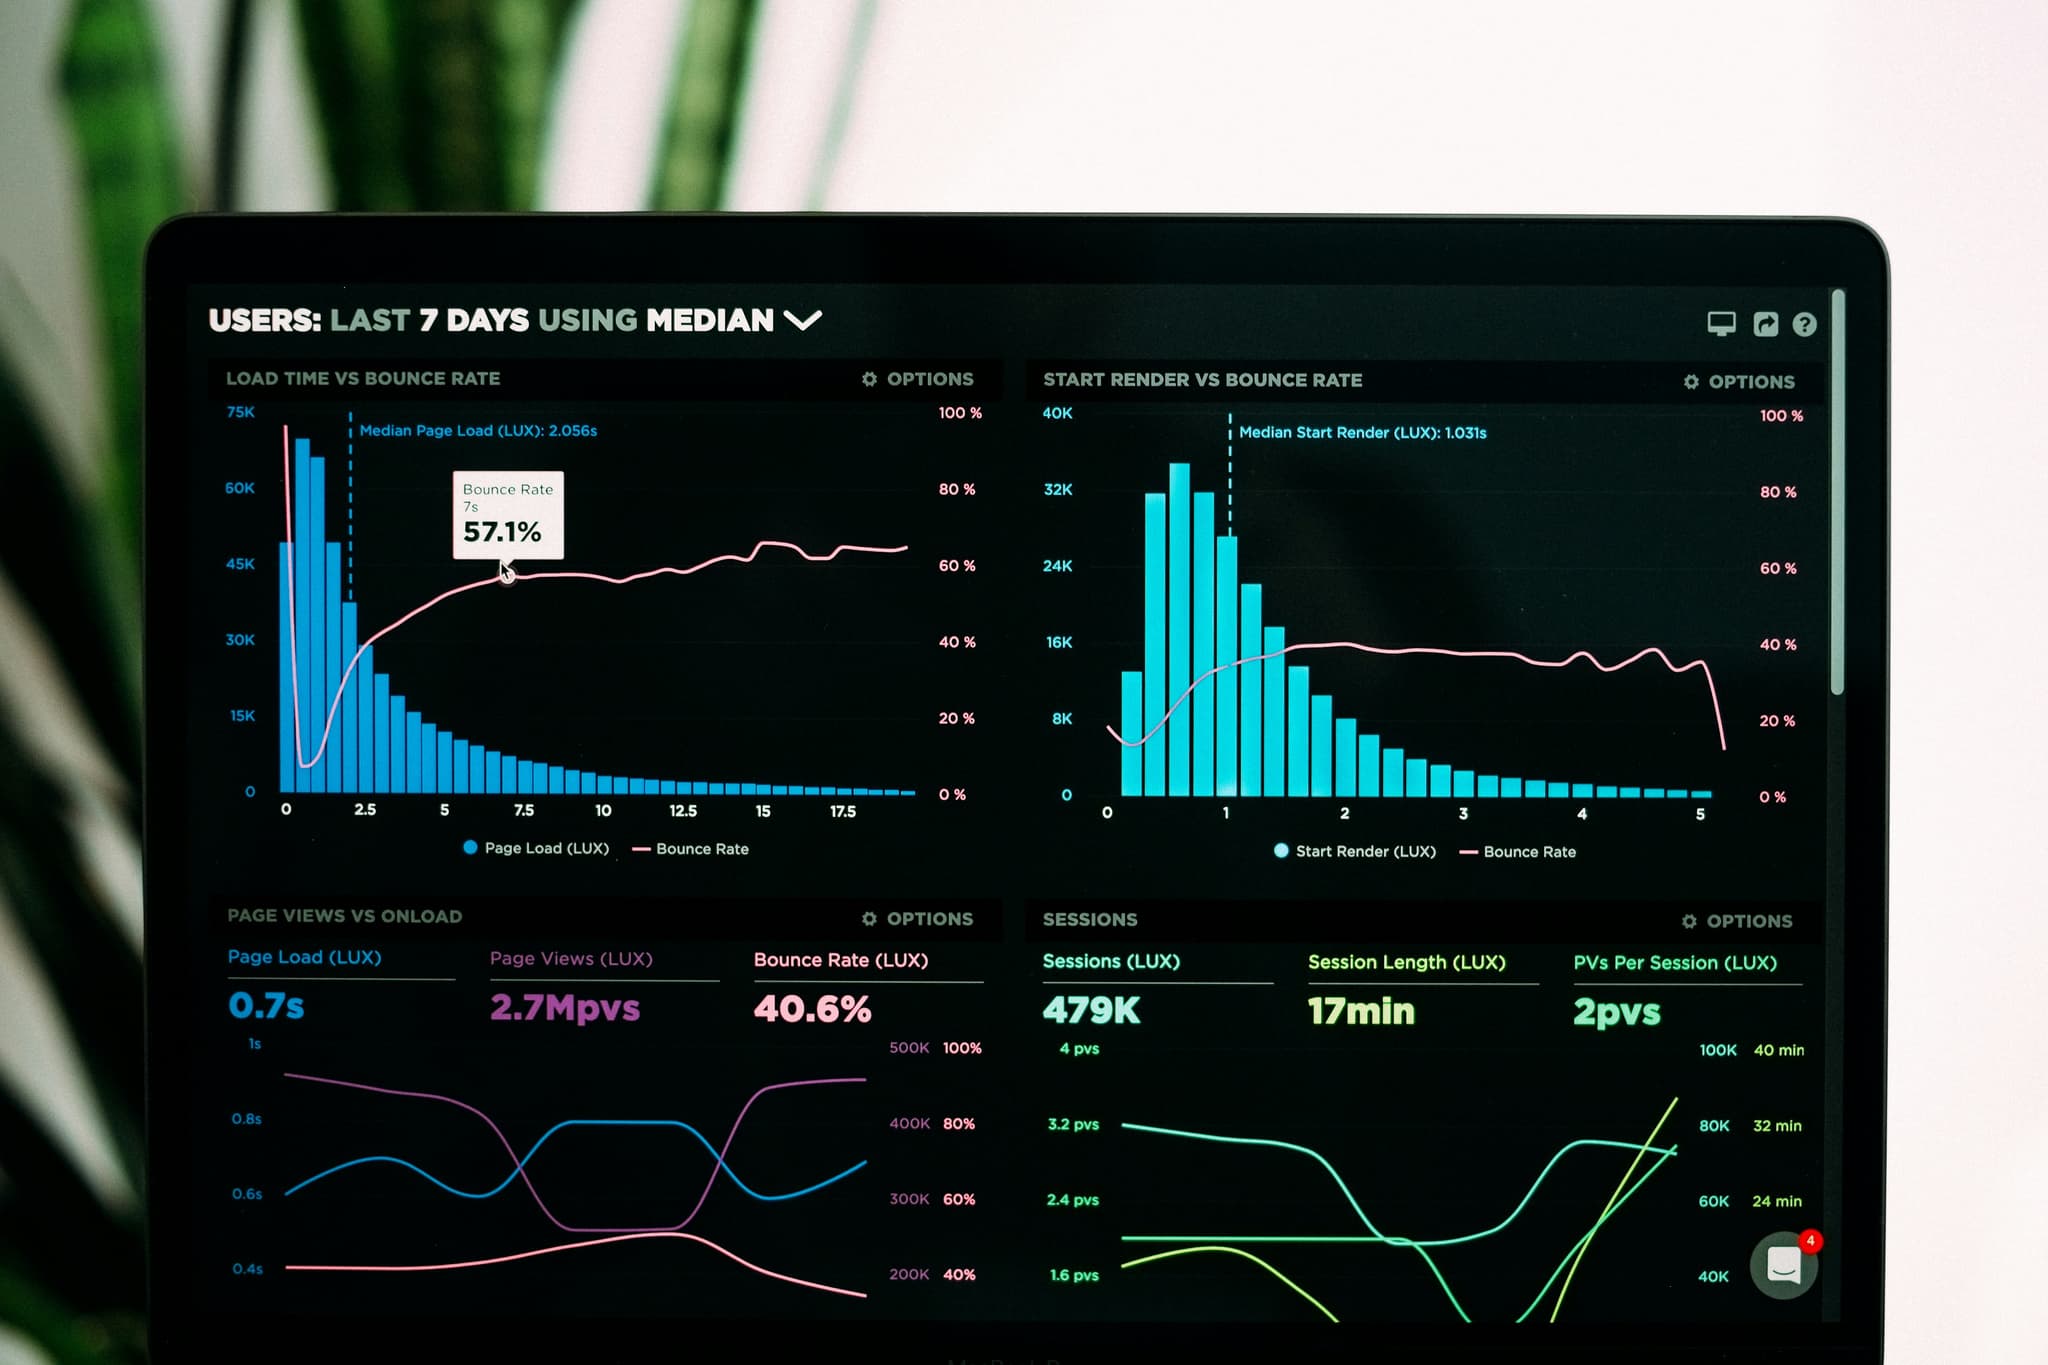
In today's rapidly changing chemical markets, businesses require timely and reliable market intelligence to make informed procurement, trading, and production decisions. A Monthly Chemical Price Dashboard serves as a valuable tool that consolidates pricing data, market trends, supply-demand indicators, and key market drivers into a single, easy-to-understand format.
Chemical manufacturers, procurement teams, distributors, and traders rely on these dashboards to monitor market conditions, identify pricing trends, assess risks, and forecast future movements. However, the effectiveness of a dashboard depends heavily on the methodology used to collect, analyze, and present market data.
This article explains the methodology behind a Monthly Chemical Price Dashboard and highlights the key components that contribute to accurate and actionable market insights.
What Is a Chemical Price Dashboard?
A Chemical Price Dashboard is a structured reporting tool that provides a comprehensive view of chemical market pricing and related market indicators over a specific period, typically monthly.
The dashboard helps stakeholders:
Track price movements.
Monitor market trends.
Compare regional pricing.
Evaluate supply-demand conditions.
Identify procurement opportunities.
Support forecasting and budgeting activities.
By presenting complex market information in a visual and organized format, dashboards enable faster and more informed decision-making.
Objectives of a Monthly Chemical Price Dashboard
The primary purpose of a monthly dashboard is to provide a clear overview of market performance and pricing developments.
Key objectives include:
Market Visibility
Providing stakeholders with a consolidated view of current chemical market conditions.
Price Trend Analysis
Tracking monthly changes in product pricing across different regions and markets.
Procurement Support
Helping buyers identify favorable purchasing opportunities and potential cost risks.
Forecasting Assistance
Providing data that supports future market outlooks and budgeting processes.
Risk Management
Highlighting market developments that may impact supply chains, pricing, or product availability.
Data Collection Methodology
Accurate dashboards begin with reliable data collection.
Primary Market Data
Primary data is collected directly from market participants, including:
Manufacturers.
Distributors.
Traders.
Procurement professionals.
End users.
These sources provide real-time insights into transaction prices, demand conditions, and market sentiment.
Secondary Market Data
Secondary data includes information gathered from:
Industry reports.
Trade publications.
Government statistics.
Customs and trade databases.
Market intelligence platforms.
Combining multiple sources improves data accuracy and market coverage.
Historical Data Integration
Historical pricing data is included to identify trends, seasonal patterns, and long-term market movements.
This historical context allows users to compare current market conditions with previous periods.
Key Pricing Components Included in the Dashboard
Chemical Product Prices
The dashboard typically tracks key commodity and specialty chemicals such as:
Methanol.
Polyethylene.
Polypropylene.
Caustic Soda.
Acetic Acid.
Ethylene Glycol.
Toluene.
Benzene.
Prices are usually reported on a monthly average basis to reduce short-term volatility.
Regional Price Comparisons
Prices are analyzed across major markets such as:
Asia-Pacific.
Europe.
North America.
Middle East.
Latin America.
Regional comparisons help businesses identify sourcing opportunities and understand market competitiveness.
Month-over-Month Price Changes
The dashboard calculates percentage changes between the current month and the previous month.
This metric helps stakeholders quickly identify:
Rising markets.
Declining markets.
Stable pricing environments.
Supply and Demand Analysis
Price movements cannot be understood without evaluating market fundamentals.
Supply Indicators
The dashboard tracks:
Plant operating rates.
Capacity utilization.
Production outages.
Planned maintenance shutdowns.
Capacity expansions.
These indicators help assess market availability.
Demand Indicators
Demand analysis includes:
Industrial production activity.
Manufacturing trends.
End-user consumption patterns.
Customer purchasing activity.
Inventory replenishment cycles.
Strong demand often supports higher pricing levels.
Feedstock Monitoring
Feedstock costs are among the most important drivers of chemical prices.
A comprehensive dashboard tracks:
Crude oil prices.
Natural gas prices.
Naphtha prices.
Ethane prices.
Propylene prices.
Ethylene prices.
Monitoring feedstock movements helps explain downstream chemical price changes and supports forecasting efforts.
Freight and Logistics Analysis
Transportation costs significantly affect chemical pricing and regional competitiveness.
The dashboard typically includes:
Ocean Freight Rates
Monitoring container shipping costs across major trade routes.
Fuel Costs
Tracking changes in fuel prices that influence transportation expenses.
Port and Supply Chain Conditions
Assessing:
Port congestion.
Shipping delays.
Container availability.
Logistics disruptions.
Freight analysis helps estimate landed costs and procurement risks.
Market Sentiment Assessment
Market sentiment provides insight into future pricing expectations.
The dashboard evaluates:
Buyer confidence.
Supplier outlook.
Inventory strategies.
Purchasing activity.
Market inquiries.
Sentiment indicators often serve as early warning signals for potential market shifts.
Forecasting Methodology
Most monthly dashboards include short-term market forecasts.
Common forecasting approaches include:
Historical Trend Analysis
Examining previous pricing patterns to identify recurring trends.
Feedstock-Based Forecasting
Estimating future prices based on expected feedstock movements.
Supply-Demand Modeling
Projecting market balances using production and consumption data.
Expert Market Assessment
Incorporating industry insights from analysts, traders, and market participants.
Combining multiple forecasting techniques improves reliability and accuracy.
Dashboard Visualization Techniques
To improve usability, dashboards often present information through:
Trend charts.
Price comparison tables.
Heat maps.
Regional performance indicators.
Market sentiment gauges.
Supply-demand scorecards.
Visual representation allows users to interpret market developments quickly and effectively.
Benefits of a Monthly Chemical Price Dashboard
Organizations that use structured market dashboards benefit from:
Better Procurement Decisions
Buyers gain greater visibility into pricing trends and market opportunities.
Improved Budgeting
More accurate cost forecasts support financial planning and resource allocation.
Enhanced Risk Management
Early identification of market disruptions helps organizations respond proactively.
Stronger Market Intelligence
Decision-makers gain a deeper understanding of market drivers and industry trends.
Competitive Advantage
Access to timely and reliable information enables faster and more strategic business decisions.
Future Developments in Chemical Price Dashboards
Advancements in digital technologies are transforming chemical market intelligence.
Future dashboards will increasingly incorporate:
Artificial intelligence.
Machine learning models.
Predictive analytics.
Real-time data feeds.
Automated market alerts.
Advanced scenario analysis.
These innovations will improve forecasting accuracy and provide more actionable insights.
Conclusion
A Monthly Chemical Price Dashboard is a powerful tool for monitoring market conditions, tracking pricing trends, and supporting strategic decision-making. By combining pricing data, supply-demand analysis, feedstock monitoring, freight intelligence, and forecasting methodologies, dashboards provide a comprehensive view of chemical market performance.
As chemical markets become more complex and volatile, organizations that leverage structured and data-driven dashboard methodologies will be better equipped to manage risk, optimize procurement strategies, and maintain a competitive advantage in the global marketplace.
Caustic Soda Pearls - China CAS: 1310-73-2